Every business operates within changing financial conditions. Markets rise and fall, costs fluctuate, and customer behavior shifts in ways that can feel sudden. A financial weather map offers a practical way to visualize these movements, helping leaders prepare for what is coming. This approach uses patterns, indicators, and data signals to support steadier decision-making.
What a Financial Weather Map Represents
A financial weather map is a structured view of internal and external financial signals. It combines revenue trends, expense cycles, cash flow timing, and market indicators into a single perspective. Like a real forecast, it does not promise certainty, but it highlights conditions that increase risk or opportunity.
For businesses, this means recognizing early signs of tightening margins, slowing demand, or rising input costs. It also reveals periods of stability where investment or expansion may be safer. The value lies in context rather than prediction.
Key Indicators That Shape the Forecast
Several data points act as the equivalent of pressure systems and wind patterns. Cash flow timing shows where liquidity may thin. Sales velocity points to demand strength or fatigue. Accounts receivable aging can signal payment delays before they disrupt operations.
External factors matter as well. Interest rate changes, supplier pricing shifts, and broader economic reports influence planning decisions. Some companies also monitor market behavior through tools similar to those used on a day trader platform, not to speculate, but to observe volatility and sentiment trends that may affect their sector.
Using the Map for Strategic Planning
Once indicators are visible, the financial weather map becomes a planning tool. Leadership teams can test scenarios such as reduced demand, higher labor costs, or delayed payments. These exercises help prioritize actions like adjusting inventory levels, revising pricing strategies, or securing additional credit before it becomes urgent.
This approach also supports timing decisions. Capital investments, hiring plans, or marketing campaigns can be aligned with periods of financial calm rather than launched during instability. The result is fewer surprises and more controlled growth.
Improving Cross-Team Awareness
A shared financial weather map improves communication across departments. Finance, operations, and sales teams can reference the same signals, reducing misalignment. When everyone understands current conditions, conversations shift from blame to preparation.
For example, if the map shows tightening cash flow in the coming quarter, teams can collaborate on expense control or revenue acceleration rather than scrambling later. Transparency builds trust and faster response times.
Adjusting as Conditions Change
A financial weather map is not static. It should be reviewed regularly and updated as new data arrives. Quarterly reviews may work for stable businesses, while others benefit from monthly or even weekly updates.
Flexibility is essential. Just as a forecast adjusts when storms change direction, financial planning must evolve with new information. Businesses that revisit assumptions stay ahead of disruptions instead of reacting to them.
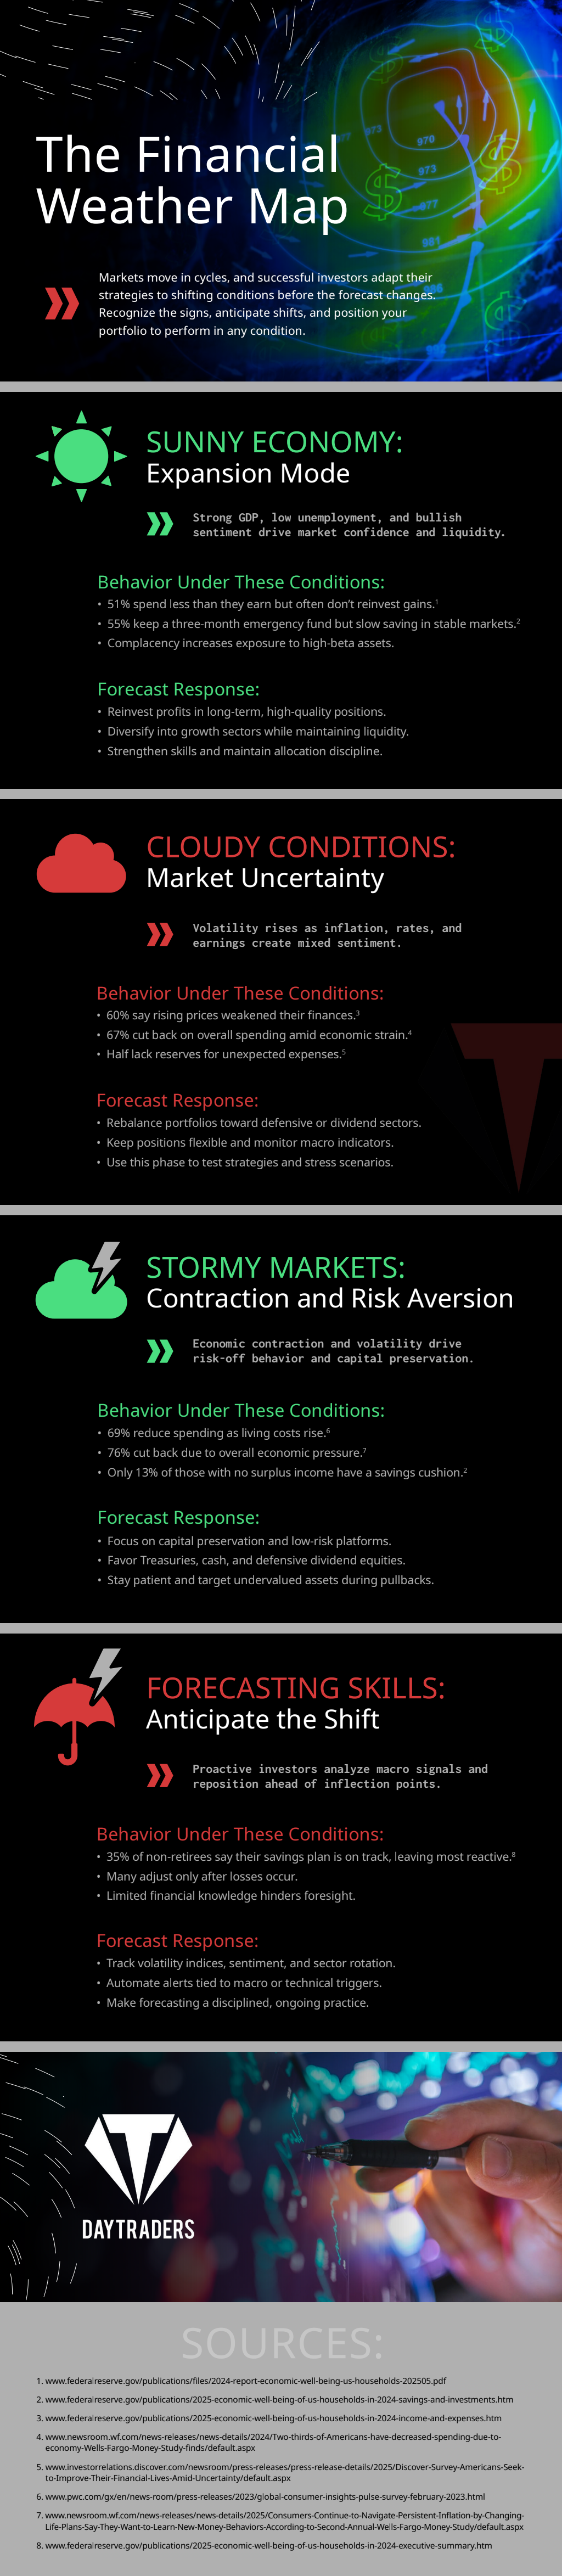
Financial conditions will always shift. A financial weather map helps businesses see those shifts sooner, plan with clarity, and move forward with confidence even when uncertainty is part of the landscape. Check out the infographic below for more information.